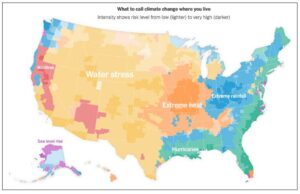
Climate Threats
The map shows different climate threats across regions of the United
States. Each color represents a different threat, labeled on the map.
News Story | NGSS Standard: MS-ESS3 Earth & Human Activity

This material is based upon work supported by the National Science Foundation under Grant No. (IIS-1900606). Any opinions, findings, and conclusions or recommendations expressed in this material are those of the author(s) and do not necessarily reflect the views of the National Science Foundation.